Search
found 6359 results
Images for canterbury earthquakes; more images...

EQC chief responds to highly critical report
Audio, Radio New Zealand
A new report says the Earthquake Commission was ill-prepared for a major earthquake and had to use inexperienced staff to respond to the Canterbury earthquakes.
Christchurch Earthquake 22/02/11
Images, eqnz.chch.2010
Christchurch Cathedral, photo taken from the Warners Novotel, Cathedral Square.
SPCA Canterbury Photograph 25
Images, UC QuakeStudies
A photograph of members of Massey University's Veterinary Emergency Response Team (VERT) working in the central city red zone after the 22 February 2011 earthquake. VERT travelled to Christchurch after the 22 February 2011 earthquake in order to assist with caring for animals. Each member is wearing a hard hat, face masks, and a head lamp.
Nisbet, Alistair, 1958- :"Earthquake? No... this is an extreme adventure a…
Images, Alexander Turnbull Library
A tall building sways and groans, creaks and rumbles during an earthquake. Someone from inside at the top of the building says 'Earthquake? No... This is an extreme adventure activity that you'll be billed for later!' Context - The earthquakes in Christchurch and the Canterbury region. The three major ones were on 4th September 2010, 22 February 2011 and 13 June 2011 and there have been hundreds of aftershocks. Quantity: 1 digital cartoon(s).
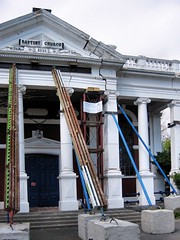
Temple for Christchurch
Other, National Library of New Zealand
A large scale interactive art installation that seeks to provide a mechanism for emotional healing alongside the physical rebuilding of the city.
What is that?
Other, National Library of New Zealand
Blog designed to act as a forum to document, share and discuss street art and creative activities in Christchurch. Created by Ben Leith.
Canterbury Health System Earthquake Memories, Story 43: Operated 24/7
Articles, UC QuakeStudies
An earthquake memories story from Kevin Taylor, Quality and Business Development Labs Management, Canterbury Health Laboratories, titled, "Operated 24/7".
Borehole Sediment Samples: Canterbury Museum
Images, Canterbury Museum
Eight white corflute boxes of sediment samples from the borehole drilled adjacent to the Canterbury Museum Rolleston Avenue facade following the 22 February 2011 earthquake. Project number 52160, Bore hole BH02 These sediment samples are from machine drilled borings taken from the land near the Rolleston Avenue facade of Canterbury Museum. The ...
Earthquake Recovery Minister reacts to call for inquiry
Audio, Radio New Zealand
After calls for an inquiry into Christchurch home repairs, Canterbury Earthquake Recovery Minister Gerry Brownlee joins Checkpoint.
Hubbard, James, 1949- :Canterbury lamb... 16 June 2011
Images, Alexander Turnbull Library
Text reads 'Canterbury lamb...' and the cartoon shows a slavering wolf that represents 'earthquake' dressed in 'lamb's clothing' and prowling in the night among other sheep. Context - The saying 'a wolf in sheep's clothing' that suggests something sinister sheltering behind something benign. Refers to the devastating Christchurch earthquakes of 2010 and 2011. A third very damaging earthquake occured on 13th June 2011. 'Canterbury lamb' is well-known as a favourite meat overseas. Quantity: 1 digital cartoon(s).
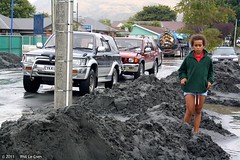
Liquidity - After Christchurch Earthquake
Images, eqnz.chch.2010
None
The Spatial and Temporal Patterns of Anxiety and Chest Pain Resulting From…
Research papers, University of Canterbury Library
The aim of this thesis was to examine the spatial and the temporal patterns of anxiety and chest pain resulting from the Canterbury, New Zealand earthquaeks. Three research objectives were identified: examine any spatial or termporal clusters of anxiety and chest pain; examine the associations between anxiety, chest pain and damage to neighbourhood; and determine any statistically significant difference in counts of anxiety and chest pain after each earthquake or aftershock which resulted in severe damage. Measures of the extent of liquefaction the location of CERA red-zones were used as proxy measures for earthquake damage. Cases of those who presented to Christchurch Public Hospital Emergency Department with either anxiety or chest pain between May 2010 and April 2012 were aggregated to census area unit (CAU) level for analysis. This thesis has taken a unique approach to examining the spatial and spatio-temporal variations of anxiety and chest pain after an earthquake and offers unique results. This is the first study of its kind to use a GIS approach when examining Canterbury specific earthquake damage and health variables at a CAU level after the earthquakes. Through the use of spatio-termporal scan modelling, negative and linear regression modelling and temporal linear modelling with dummy variables this research was able to conclude there are significant spatial and temporal variations in anxiety and chest pain resulting from the earthquakes. The spatio-termporal scan modelling identified a hot cluster of both anxiety and chest pain within Christchurch at the same time the earthquakes occurred. The negative binomial model found liquefaction to be a stronger predictor of anxiety than the Canterbury Earthquake Recovery Authority's (CERA) land zones. The linear regression model foun chest pain to be positively associated with all measures of earthquake damage with the exception of being in the red-zone. The temporal modelling identified a significant increase in anxiety cases one month after a major earthquake, and chest pain cases spiked two weeks after an earthquake and gradually decreased over the following five weeks. This research was limited by lack of control period data, limited measures of earthquake damage, ethical restrictions, and the need for population tracking data. The findings of this research will be useful in the planning and allocation of mental wellbeing resources should another similar event like the Canterbury Earthquakes occur in New Zealand.
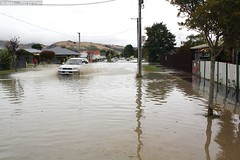
Kaiapoi, earthquake damage
Images, eqnz.chch.2010
Damage from the Christchurch 7.1 earthquake on 4th Sept 2010
Gina King's Story
Articles, UC QuakeStudies
Summary of oral history interview with Gina King about her experiences of the Canterbury earthquakes.
Loretta Rhodes' Story
Articles, UC QuakeStudies
Summary of oral history interview with Loretta Rhodes about her experiences of the Canterbury earthquakes.
Alana Harvey's Story
Articles, UC QuakeStudies
Summary of oral history interview with Alana Harvey about her experiences of the Canterbury earthquakes.
SPCA Canterbury Photograph 08
Images, UC QuakeStudies
A photograph of a veterinarian giving a stray cat a worming tablet and checking its teeth after the 22 February 2011 earthquake.
Ella's Story
Articles, UC QuakeStudies
Summary of oral history interview with Ella about her experiences of the Canterbury earthquakes.
Canterbury Health System Earthquake Memories, Story 35: Community pharmaci…
Articles, UC QuakeStudies
An earthquake memories story titled, "Community pharmacies push on through".
Nisbet, Alistair, 1958- :Slow progress after Christchurch earthquakes. 19 …
Images, Alexander Turnbull Library
Two men chat over the fence about the state of their houses after the 4th September earthquake in Christchurch. One of them is complaining about the slow pace of reconstruction of houses after the magnitude 7.1 earthquake on 4 September 2010; the second man thinks they are doing their best. Context - Frustration over the slow rate of processing insurance applications and building inspections after the magnitude 7.1 earthquake on 4 September 2010 which although it resulted in a lot of damage, no-one died. In the cartoon the man's red sticker (meaning the house is uninhabitable) has faded to green after being put on the house after the September earthquake. Three days after this cartoon was published the much more disastrous earthquake of the 22nd February struck and many people died. Quantity: 1 digital cartoon(s).
Hurunui District engineering lifelines project: Natural hazard assessment
Articles, UC QuakeStudies
This report was the first report in the district series, and has a different format to later reports. It includes all natural hazards, not only earthquake hazards. It describes earthquake, flooding, meteorological, landslide and coastal hazards within Hurunui district and gives details of historic events. It includes district-scale (1:250,000) active fault and flood hazard maps. The report describes an earthquake scenario for a magnitude 6.9 earthquake near Cheviot, as well as flooding, meteorological, landslide, coastal erosion, storm surge, and tsunami scenarios.
Photo 015
Images, UC QuakeStudies
Large cracks on a street in Avonside barred off with police tape after the September 4th earthquake.
Photo 016
Images, UC QuakeStudies
Large cracks on a street in Avonside barred off with police tape after the September 4th earthquake.
Photo 004
Images, UC QuakeStudies
Liquefaction dug out of properties and piled on the streets in Avonside after the September 4th earthquake.
Photo 025
Images, UC QuakeStudies
Cones marking a crack in the centre of a street in Avonside after the September 4th earthquake.
Photo 052
Images, UC QuakeStudies
Cracks in the parking lot in front of a store in Kaiapoi, after the September 4th earthquake.
Photo 063
Images, UC QuakeStudies
Liquefaction and damage to tiles in front of a store in Kaiapo, after the September 4th earthquake.
4 September 2010 Canterbury Earthquake (26 November)
Articles, UC QuakeStudies
PDF slides from a presentation given by Dr. Thomas Wilson from the UC Geology department on 26 November 2010. The presentation was delivered at a public talk for the Rolleston community.
The new Canterbury Earthquake Recovery Authority - CERA
Audio, Radio New Zealand
Public and electoral law professor at Otago University, Andrew Geddis.
Council questioned at Canterbury Earthquake Royal Commission
Audio, Radio New Zealand
A man whose wife was killed when the CTV building collapsed says the council's inspections after the September quake were in a mess and signage put on some buildings sent the wrong message that they were safe to occupy.