Search
found 6359 results
Images for canterbury earthquakes; more images...

Dallington 5
Articles, UC QuakeStudies
A photograph showing Geoff Devoll and Anna Kouwenhoven in their 'red zoned' home, soon to be demolished following the series of earthquakes in Christchurch.
Horseshoe Lake 1
Articles, UC QuakeStudies
A digital photograph in a PDF format with caption. Image showing the view of the Avondale bridge during the 2012 Earthquake Memorial, looking East.
this wasn't here when we left
Images, eqnz.chch.2010
Laura and Max return to Christchurch from their holiday in California and inspect the earthquake-caused sand volcano in their front lawn.
Castle Rock scarred
Images, eqnz.chch.2010
The magnitude 7.1 Christchurch earthquake broke off an enormous chunk of Castle Rock in the Port Hills which has tumbled down towards the Lyttelton tunnel. View from Morgan's Valley (-43.578037° 172.714828°).
Urban Disaster Recovery in Christchurch: The Central Business District Cor…
Research papers, University of Canterbury Library
The Canterbury earthquakes, which involved widespread damage in the February 2011 event and ongoing aftershocks near the Christchurch central business district (CBD), presented decision-makers with many recovery challenges. This paper identifies major government decisions, challenges, and lessons in the early recovery of Christchurch based on 23 key-informant interviews conducted 15 months after the February 2011 earthquake. It then focuses on one of the most important decisions – maintaining the cordon around the heavily damaged CBD – and investigates its impacts. The cordon displaced 50,000 central city jobs, raised questions about (and provided new opportunities for) the long-term viability of downtown, influenced the number and practice of building demolitions, and affected debris management; despite being associated with substantial losses, the cordon was commonly viewed as necessary, and provided some benefits in facilitating recovery. Management of the cordon poses important lessons for planning for catastrophic urban earthquakes around the world.
Fairfax Video, December 2012 (7)
Videos, UC QuakeStudies
A video of an interview with John Walley, Chief Executive of the New Zealand Manufacturers and Exporters Association, about the experiences of businesses in the aftermath of the 2010 and 2011 Canterbury earthquakes. Walley talks about the stress on manufacturers to continue as usual after the earthquakes. He also talks about the importance of businesses' communication lines, and looking after customers and staff. This video is part of a series about businesses in Christchurch after the earthquakes.
The Vault - Homebush Revisited
Audio, Radio New Zealand
Deborah Nation recalls visits to Homebush, the historic Deans homestead near Darfield, the wreckage of which became one of the most viewed images in the first days after the September 2010 Canterbury earthquake.
Christchurch workers bounce back, study says
Audio, Radio New Zealand
A study of employees affected by the Canterbury earthquakes has found they're more likely to have jobs - and get better pay - than people in similar roles in other parts of the country.
Nisbet, Alastair, 1958- :'To Let - Plenty of Character'. 27 April 2012
Images, Alexander Turnbull Library
Shows an enormous Earthquake Recovery Minister Gerry Brownlee portrayed as a house for rent being viewed by a couple. Context: Brownlee announced plans to alleviate Christchurch's housing shortage by increasing rental stocks (Stuff 24 April 2012) Quantity: 1 digital cartoon(s).
Resilience Examples in Reservoirs, Pump Stations and Pipelines - Lessons L…
Articles, UC QuakeStudies
A paper prepared for the Water New Zealand 2014 conference which considers resilience lessons for reservoirs, pump stations and pipelines.
Local and Central Government, Business and Media Perspectives on the Cante…
Videos, UC QuakeStudies
A video of an address by Roger Sutton, CEO of Canterbury Earthquake Recovery Authority, at the 2014 Seismics and the City forum. This talk was part of the Breakfast Presentations section, the theme of which was Building Momentum.
2D-Modelling of Earthquake-Induced Rockfall from Basaltic Ignimbrite Cliff…
Research papers, University of Canterbury Library
This thesis is concerned with modelling rockfall parameters associated with cliff collapse debris and the resultant “ramp” that formed following the high peak ground acceleration (PGA) events of 22 February 2011 and 13 June 2011. The Christchurch suburb of Redcliffs, located at the base of the Port Hills on the northern side of Banks Peninsula, New Zealand, is comprised of Miocene-age volcanics with valley-floor infilling marine sediments. The area is dominated by basaltic lava flows of the Mt Pleasant Formation, which is a suite of rocks forming part of the Lyttelton Volcanic Group that were erupted 11.0-10.0Ma. Fresh exposure enabled the identification of a basaltic ignimbrite unit at the study site overlying an orange tuff unit that forms a marker horizon spanning the length of the field area. Prior to this thesis, basaltic ignimbrite on Banks Peninsula has not been recorded, so descriptions and interpretations of this unit are the first presented. Mapping of the cliff face by remote observation, and analysis of hand samples collected from the base of the debris slopes, has identified a very strong (>200MPa), columnar-jointed, welded unit, and a very weak (<5MPa), massive, so-called brecciated unit that together represent the end-member components of the basaltic ignimbrite. Geochemical analysis shows the welded unit is picrite basalt, and the brecciated unit is hawaiite, making both clearly distinguishable from the underlying trachyandesite tuff. RocFall™ 4.0 was used to model future rockfalls at Redcliffs. RocFall™ is a two-dimensional (2D), hybrid, probabilistic modelling programme for which topographical profile data is used to generate slope profiles. GNS Science collected the data used for slope profile input in March 2011. An initial sensitivity analysis proved the Terrestrial Laser Scan (TLS)-derived slope to be too detailed to show any results when the slope roughness parameter was tested. A simplified slope profile enabled slope roughness to be varied, however the resulting model did not correlate with field observations as well. By using slope profile data from March 2011, modelled rockfall behaviour has been calibrated with observed rockfall runout at Redcliffs in the 13 June 2011 event to create a more accurate rockfall model. The rockfall model was developed on a single slope profile (Section E), with the chosen model then applied to four other section lines (A-D) to test the accuracy of the model, and to assess future rockfall runout across a wider area. Results from Section Lines A, B, and E correlate very well with field observations, with <=5% runout exceeding the modelled slope, and maximum bounce height at the toe of the slope <=1m. This is considered to lie within observed limits given the expectation that talus slopes will act as a ramp on which modelled rocks travel further downslope. Section Lines C and D produced higher runout percentage values than the other three section lines (23% and 85% exceeding the base of the slope, respectively). Section D also has a much higher maximum bounce height at the toe of the slope (~8.0m above the slope compared to <=1.0m for the other four sections). Results from modelling of all sections shows the significance of the ratio between total cliff height (H) and horizontal slope distance (x), and of maximum drop height to the top of the talus (H*) and horizontal slope distance (x). H/x can be applied to the horizontal to vertical ratio (H:V) as used commonly to identify potential slope instability. Using the maximum value from modelling at Redcliffs, the future runout limit can be identified by applying a 1.4H:1V ratio to the remainder of the cliff face. Additionally, the H*/x parameter shows that when H*/x >=0.6, the percentage of rock runout passing the toe of the slope will exceed 5%. When H*/x >=0.75, the maximum bounce height at the toe of the slope can be far greater than when H*/x is below this threshold. Both of these parameters can be easily obtained, and can contribute valuable guideline data to inform future land-use planning decisions. This thesis project has demonstrated the applicability of a 2D probabilistic-based model (RocFall™ 4.0) to evaluate rockfall runout on the talus slope (or ramp) at the base of ~35-70m high cliff with a basaltic ignimbrite source. Limitations of the modelling programme have been identified, in particular difficulties with adjusting modelled roughness of the slope profile and the inability to consider fragmentation. The runout profile using RocFall™ has been successfully calibrated against actual profiles and some anomalous results have been identified.
A System Dynamic Model of Post-Earthquake Reconstruction pathways
Research papers, University of Canterbury Library
Objectives • To develop a system dynamics model of Christchurch post-quake reconstruction process that captures all the critical dynamics influencing its pathway • To investigate the implications of current rebuild pathway • To build a reconstruction module to be integrated in MERIT (Measuring the Economics of Resilient Infrastructure Tool)
Townsend Telescope: Part Photograph 44
Images, UC QuakeStudies
A photograph of the dew and lens cap from the Townsend Telescope. The cap was crushed during the 22 February 2011 earthquake.
Townsend Telescope: Part Photograph 03
Images, UC QuakeStudies
A photograph of the Celestron eyepiece from the Townsend Telescope. The eyepiece was scratched and chipped during the 22 February 2011 earthquake.
Townsend Telescope: Part Photograph 21
Images, UC QuakeStudies
A photograph of a wooden knob from the Townsend Telescope. The knob broke off the telescope during the 22 February 2011 earthquake.
Townsend Telescope: Part Photograph 43
Images, UC QuakeStudies
A photograph of the dew and lens cap from the Townsend Telescope. The cap was crushed during the 22 February 2011 earthquake.
Supreme court has ruled in favour of earthquake hit home owners
Audio, Radio New Zealand
The Supreme Court has ruled that a class action by Canterbury insurance holders against Southern Response can go ahead. Ali Jones, insurance claimants advocate explains to The Panel what this means for home owners who've been fighting for years to get their fair entitlements.
WEMO ERT Set 1 - February 2011 - Photograph 70
Images, UC QuakeStudies
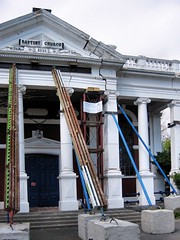
A photograph of the earthquake damage to the Base Packpackers building behind the former Canterbury Times building on Gloucester Street. The corner of Base Backpackers has collapsed, exposing a bunkroom inside. Scaffolding has been constructed up the side of the building.
Canterbury quake symposium an 'attempt to re-write history'
Audio, Radio New Zealand
A second attempt at a symposium aimed at learning from the Canterbury earthquakes has been labelled an attempt to re-write history. The first was cancelled by the previous government two months after it was announced, and after over one hundred and fifty thousand dollars had been spent on preparations. The revamped symposium is a joint venture between the government and the Christchurch City Council.
Winter, Mark 1958-:[Christchurch earthquake] "These deaths are our greates…
Images, Alexander Turnbull Library
The cartoon shows the name in large capital letters 'Christchurch' with the 't' drawn as the Christian cross symbol. Below is text reading '"These deaths are our greatest loss. They remind us that buildings are just buildings, roads just roads, but people are irreplaceable" John Key' Context - The very severe Christchurch earthquake of 22 February 2011 in which probably more than 200 people died. Two versions of this cartoon are available Quantity: 1 digital cartoon(s).
Nisbet, Alastair, 1958- :'Show 'em half a crack and they'll find a way thr…
Images, Alexander Turnbull Library
Shows snarling rats labelled 'insurance companies' in a cityscape. Context: Concerns about shortfall in insurance cover have arisen in response to the Christchurch City Council's draft annual plan, which proposes a 7.5 per cent rates increase to fund earthquake rebuild (Stuff 23 April 2012). Quantity: 1 digital cartoon(s).
Wetland Walkway
Images, eqnz.chch.2010
Otukaikino Reserve ,Christchurch .Hasn,t been open since Sept earthquake so i dont know what it is like now but it was a very nice area
EQC forced into embarrassing admission on privacy breach.
Audio, Radio New Zealand
The Earthquake Commission has been forced into an embarrassing admission that the details of all 83-thousand clients in its Canterbury Home Repair programme have been accidentally emailed to the wrong address.
Heritage order may have contributed to the deaths
Audio, Radio New Zealand
The Canterbury Earthquakes Royal Commission has heard evidence that a heritage order on a row of dangerous buildings may have contributed to the deaths of a dozen people in the February quake.
Built with earthquakes in mind – St. Michael and All the Angels Church c.1…
Articles, Lost Christchurch
The Anglican church of St. Michael and All the Angels, at 84 Oxford Terrace, stands on the site of the first church the Canterbury Association’s settlers built in 1851. Perhaps there a…
Elizabeth Ackermann Photograph 173
Images, UC QuakeStudies
A photograph of Elizabeth Ackermann's office. Elizabeth Ackermann is the administrator in the Department of Civil and Natural Resources Engineering at the University of Canterbury. The photograph was taken when she was first let back in after the 22 February 2011 earthquake.
Rebekah Rogers WEMO Photograph 093
Images, UC QuakeStudies
A photograph of a man at the 'free legal help' table in a temporary emergency management centre set up after the 22 February 2011 earthquake. The table was set up by Community Law Canterbury to offer free legal help to those in need.
NZ to import dung beetles to process organic waste. 24 September 2010
Images, Alexander Turnbull Library
A man reads a newspaper report about dung beetles being imported to process organic waste. In the second frame someone in one of a row of three portaloos wonders whether dung beetles would be better at it than the Council. Refers to the need for portaloos in the Canterbury region after the 4th September earthquake that damaged much plumbing infrastructure. Quantity: 2 digital cartoon(s).
Capacity and capability development of Canterbury subcontracting businesse…
Research papers, The University of Auckland Library
This report provides an understanding of the nature of Canterbury subcontracting businesses operating in the space of earthquake reconstruction in Christchurch. It offers an in-depth look at the factors that influence the development of their capacity and capability to withstand the impact of volatile economic cycles, including the 2008 global financial crisis and the subsequent 2010/11 Canterbury earthquakes. There have been significant changes to the business models of the 13 subcontracting businesses studied since the earthquakes. These changes can be seen in the ways the case study subcontractors have adapted to cope with the changing demands that the rebuild posed. Apart from the magnitude of reconstruction works and new developments that directly affect the capacity of subcontracting businesses in Canterbury, case studies found that subcontractors’ capacity and capability to meet the demand varies and is influenced by the: subcontractors’ own unique characteristics, which are often shaped by changing circumstances in a dynamic and uncertain recovery process; and internal factors in relation to the company’s goal and employees’ needs