Search
found 311 results
Images for [empty query]; more images...


From darkness comes light: music as a reflection of the lived experience o…
Research papers, University of Canterbury Library
Context of the project: On 4 September 2010, 22 February 2011, 13 June 2011 and 23 December 2011 Christchurch suffered major earthquakes and aftershocks (well over 10,000) that have left the central city in ruins and many of the eastern suburbs barely habitable even now. The earthquakes on 22 February caused catastrophic loss of life with 185 people killed. The toll this has taken on the residents of Christchurch has been considerable, not least of all for the significant psychological impact and disruption it has had on the children. As the process of rebuilding the city commenced, it became clear that the arts would play a key role in maintaining our quality of life during difficult times. For me, this started with the children and the most expressive of all the art forms – music.
Ground motion simulations of great earthquakes on the Alpine Fault: effect…
Research papers, University of Canterbury Library
© 2017 The Royal Society of New Zealand. This paper discusses simulated ground motion intensity, and its underlying modelling assumptions, for great earthquakes on the Alpine Fault. The simulations utilise the latest understanding of wave propagation physics, kinematic earthquake rupture descriptions and the three-dimensional nature of the Earth's crust in the South Island of New Zealand. The effect of hypocentre location is explicitly examined, which is found to lead to significant differences in ground motion intensities (quantified in the form of peak ground velocity, PGV) over the northern half and southwest of the South Island. Comparison with previously adopted empirical ground motion models also illustrates that the simulations, which explicitly model rupture directivity and basin-generated surface waves, lead to notably larger PGV amplitudes than the empirical predictions in the northern half of the South Island and Canterbury. The simulations performed in this paper have been adopted, as one possible ground motion prediction, in the ‘Project AF8’ Civil Defence Emergency Management exercise scenario. The similarity of the modelled ground motion features with those observed in recent worldwide earthquakes as well as similar simulations in other regions, and the notably higher simulated amplitudes than those from empirical predictions, may warrant a re-examination of regional impact assessments for major Alpine Fault earthquakes.
Government Building Worcester Street – Building for the Future
Articles, Lost Christchurch
The construction of government buildings have long attracted opinion and criticism and the Italian Renaissance style Government Buildings on the corner of Worcester street and Cathedral Square were…
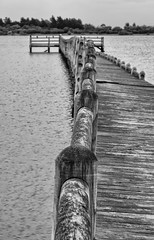
20170321_4180_7D2-70 Still bent and broken (12/52)
Images, eqnz.chch.2010
73 months after the earthquake that damaged it, the jetty at South New Brighton Domain is still not repaired. Seven years ago it was straight and level. Dull, flat and orrible (horrible) light meant this image was destined to become monochrome!
20170509_6305_7D2-62 Remembrance (129/365)
Images, eqnz.chch.2010
Today was the first time I have been to the earthquake memorial since it was completed and opened on 22nd February 2017, six years after the devastating quake that killed the 185 that are named on this wall. I knew two of the people on the list.
20170704_9090_7D2-24 Only two left (185/365)
Images, eqnz.chch.2010
Only two of 20 houses left in the Rawhiti Earthquake Village. This from the sign on perimeter fence: "Since 2011, Rawhiti Domain has been used to provide temporary accommodation for those affected by the Canterbury earthquakes. Over 200 households have used the 20 houses while their own homes have been repaired or rebuilt. The demand for acco...
20170918_6084_7D2-41 Demolition still happening (260/365)
Images, eqnz.chch.2010
Six ½ years after the earthquakes there are still a few demolitions taking place. This one is a block of council owned flats. Whether the whole complex is being demolished or not I don't know., but here the centre block of three is being demolished. The green grass is what was sections and houses demolished in 2012-2015 as it is too close to t...
20171103_5588_1D3-70 Cabbage Tree in the Red Zone
Images, eqnz.chch.2010
An impressive Cabbage Tree (Cordyline australis) that was in someone's back yard prior to the demolition of houses post the 2011 earthquake.
20171103_5582_1D3-38 Trees in the Red Zone (307/365)
Images, eqnz.chch.2010
In what used to be sections with houses and yards. Between late 2011 and 2014 the houses (well 95% of them) were removed due to land dropping in the 2011 earthquakes and the proximity of the Avon River, tidal in this area.
20171103_5586_1D3-66 Phoenix Palm in the Red Zone
Images, eqnz.chch.2010
A Phoenis Palm (Phoenix canariensis) that was in someone's back yard prior to the demolition of houses post the 2011 earthquake.
Insuring earthquakes: How would the Californian and Japanese insurance pro…
Research papers, Victoria University of Wellington
Earthquakes are insured only with public sector involvement in high-income countries where the risk of earthquakes is perceived to be high. The proto-typical examples of this public sector involvement are the public earthquake insurance schemes in California, Japan, and New Zealand (NZ). Each of these insurance programs is structured differently, and the purpose of this paper is to examine these differences using a concrete case-study, the sequence of earthquakes that occurred in the Christchurch, New Zealand, in 2011. This event turned out to have been the most heavily insured earthquake event in history. We examine what would have been the outcome of the earthquakes had the system of insurance in NZ been different. In particular, we focus on the public earthquake insurance programs in California (the California Earthquake Authority - CEA), and in Japan (Japanese Earthquake Reinsurance - JER). Overall, the aggregate cost to the public insurer in NZ was $NZ 11.1 billion in its response to the earthquakes. If a similar-sized disaster event had occurred in Japan and California, homeowners would have received $NZ 2.5 billion and $NZ 1.4 billion from the JER and CEA, respectively. We further describe the spatial and distributive patterns of these different scenarios.