
A map showing the location of TC3 land.

An infographic giving costs for land remediation.
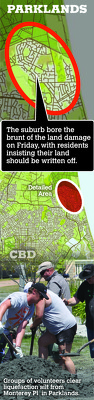
An infographic about land damage in Parklands.

Graphs comparing vacant industrial land across Christchurch.

A cartoon about the wait for land reports.

A two-page feature titled, 'The Land Report'.

A page layout for a feature titled, "The land report".

A page banner for a feature titled, "The land report".

A page banner for a feature titled, 'The Land Report'.

A page banner promoting an article about land damage assessment.

A page banner for a feature titled, 'The Land Report'.

A page layout for a feature titled, "The land report".

A page banner promoting an article about land damage assessment.

A page banner for a feature titled, "The land report".

A map showing proposed land zoning in north-west Christchurch.

A map showing the location of Orange-Zoned land in Canterbury.

An infographic comparing the costs of red-zoning and remediating land.

A map showing likely residential land availability in the Eastern Waimakariri district.

A page banner promoting a lift-out titled, "Land and new homes".

A page banner advertising a feature titled, 'The Land Report Part 2'.

A map showing the extent of liquefaction-related land damage in Christchurch.

You can see the movement of the curb and drop of land

A map showing the vertical displacement of land in Christchurch and Banks Peninsula.

Page one of a two-page feature titled, 'The Land Report Part 2'.

Page two of a two-page feature titled, 'The Land Report Part 2'.

An infographic comparing numbers of complaints received by property owners about their land zoning.

A Sepctra precision laser used to survey the land at the College of Education.

A graphic describing a proposal to use demolition rubble for land reclamation in Lyttelton.

35 Hargood Street, Woolston - earthquake land damage. Second house away from the Woolston Club.

The front page graphic for a supplement to The Press titled, "Land and new homes".