
A map showing the locations of tall buildings to be demolished.

A map showing Green, Orange, Red, and White Zones in Kaiapoi.

A page layout comparing the February and September earthquakes.

An infographic showing the status of houses in Brooklands and Spencerville.

A chart showing the drop in crime rates in Canterbury.

A map showing the location of remaining Orange-Zoned properites.

A page banner promoting an article titled, "Starting again".

A graph showing the impact of the earthquakes on workplaces.

A page banner promoting an article about Roger Sutton.

A map showing the probability of aftershocks in Canterbury for a 24-hour period.

A page banner listing earthquake-related articles.

A graphic for an article titled, "A symbol of hope".
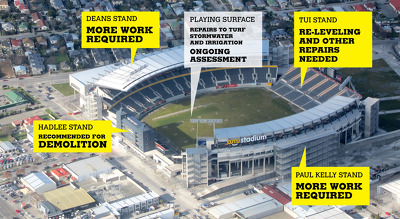
An infographic showing the status of AMI Stadium.

A map showing the locations of fault lines in the upper South Island.

A page banner listing earthquake-related articles.

A map showing an area of the CBD Red Zone to be reopened.

A page banner promoting an article titled, "CBD plan adopted".

The front page graphic for The Press. The main headline reads, "Facing the future".

A page banner listing earthquake-related articles.

The front page graphic for the Mainlander section of The Press. The main headline reads, "Rising from the rubble".

A map showing the location of businesses in Sydenham.
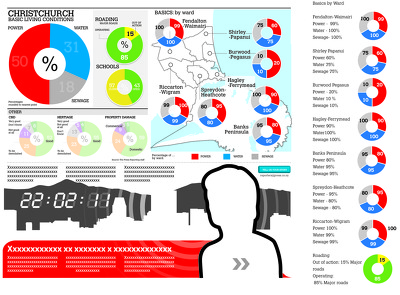
An incomplete infographic showing damage to services.

A chart showing the results of a poll, comparing responses from Canterbury to those from the rest of New Zealand.

An infographic showing the status of houses in Parklands and Queenspark.

An map showing an area where sewers have been declared useable.

A chart showing the results of an on-line poll that asked, "Should Christ Church Cathedral be saved?".

A page banner for a special report titled, "Faultlines".

A map showing the location of a proposed new subdivision.

A front page graphic for The Press. The main headline reads, "Thank you".

An incomplete map showing the distribution area for chemical toilets.