
The front page graphic for a guide titled, 'Open for business'.

Page banners with images from the 22 February 2011 earthquake.

Page banners with images from the 22 February 2011 earthquake.

An infographic describing Budget announcements, including the Canterbury Earthquake Recovery Fund.

A graphic advertising a video of demolition in the red zone.

A page layout for a feature titled, "The land report".

A page banner promoting an article about business after the earthquake.

A page banner for a feature titled, "The land report".

A timeline of the CTV building's history.

A graph showing revenue for the film, "When a City Falls".

An infographic showing the location of closed shops in Merivale Mall.

A map showing the location of road closures due to demolitions.

An infographic giving statistics for the Fletchers Canterbury home repair programme.

A graphic illustrating the hopes of orange-zoned residents in Southshore.

A graphic showing the types of building damage caused by earthquakes.

A page banner promoting an article about the Student Volunteer Army.

A map showing a proposed memorial area along the Avon River.
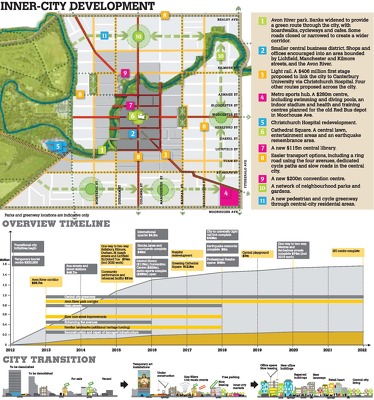
An infographic giving an overview of the draft Central City Plan.

An uncompleted chart showing numbers of performances by the Court Jesters.

A page banner promoting an article titled, "Rapping in the rubble".

A map showing the locations of free Telecom wi-fi sites.

A map showing supermarkets closed since the 22 February 2011 earthquake.

A map showing the locations of aftershocks since 4 September 2010.

A page banner promoting a feature about the Re:Start mall

A map of the CBD cordon as of 22 March 2011.

An incomplete map showing the status of wastewater pipes across Christchurch.

An infographic showing the status of buildings in central Christchurch.

An infographic showing the status of buildings in central Christchurch.

A page banner promoting an article titled, "Cracks on the tracks".

A map showing the location of Orange-Zoned land in Canterbury.