
A cartoon suggesting a combined hospital and stadium.

Graphs showing changes in economic activity, prices, and the labour market.

A graphic giving statistics on accidents involving cyclists and motor vehicles.

A table showing the results of a survey on insurance claims.

A chart giving estimated costs for demolition of the Hotel Grand Chancellor.

A graph showing changes in house prices in Canterbury and Westland.

A graphic illustrating quotes from young people about the central city.

A graphic giving details about the river park proposed in the Christchurch Central Recovery Plan.

A graphic promoting a discussion on press.co.nz of an article about the sister of earthquake victim Jamie Gilbert.

A page banner promoting an article titled, "Pop-up stand? Softer option for Hagley Park oval".

A page banner promoting an article about Mayor Bob Parker's comments on Wellington's earthquake risk.

A map showing the location of fracking permits in Canterbury.
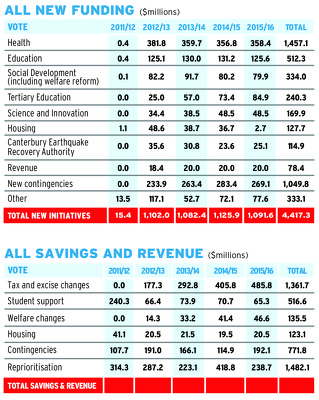
A table giving details of the budget.

A graphic showing details of the window of the Transitional Cathedral.

The front page graphic for a feature marking the anniversary of the 22 February 2011 earthquake. The feature is titled, "The year that was".

A table showing CERA's operational expenditure.
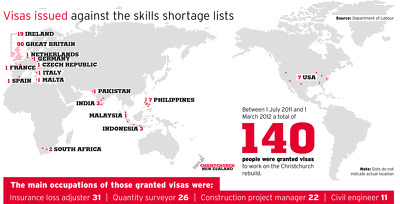
An infographic giving statistics about visas granted to rebuild workers.

An infographic made up of tables showing changes to Christchurch immigration rates.

An incomplete infographic showing the location and magnitude of aftershocks.
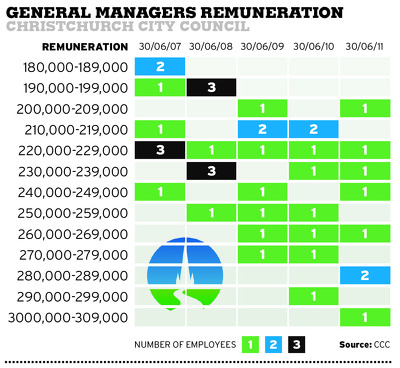
An infographic showing the salaries of Christchurch City Council managers.

A page banner promoting an article about a pavement art chalk drawing of Christchurch.

An infographic comparing property values across the South Island.

An infographic showing migration from Christchurch.

A page banner promoting a lift-out titled, "Land and new homes".

A page banner promoting an article about the Transitional Cathedral.

An infographic listing statistics for the 500 days since 4 September 2010.

An infographic listing common changes Cantabrians have made to their lives since 4 September 2010.

An infographic showing increases in property prices in Christchurch, Waimakariri and Selwyn.
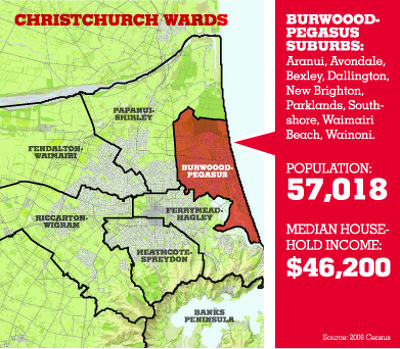
An infographic giving information about Burwood-Pegasus ward.

A page banner promoting an article titled, "Sign of the times".