
A map showing the status of hill suburbs.

A map showing the location of the temporary bus exchange.

A map showing Green, Orange, Red, and White Zones in Kaiapoi.

A graph showing the number and magnitudes of earthquakes since 4 September 2010.
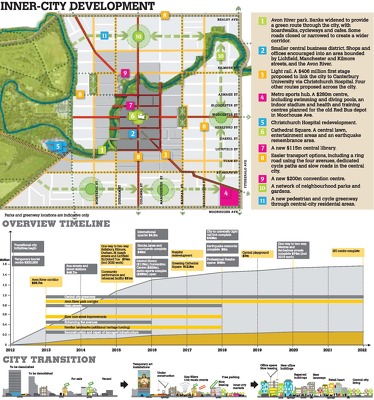
An infographic giving an overview of the draft Central City Plan.

An uncompleted chart showing numbers of performances by the Court Jesters.

A chart showing the status of EQC claims.

A graph showing changes in residential building work.

A timeline for the Recovery Strategy.

A page banner promoting an article titled, "Rapping in the rubble".

A page banner promoting an article about business closures in Sumner.

A page banner promoting an article titled, "Planning a new home".

An infographic showing areas of Kaiapoi likely to be abandoned.

A graphic to accompany an article titled, "City Council business divide".

A map showing Green and White Zones on Banks Peninsula.

An uncompleted map showing the proposed locations of car parks in the central city.

A chart showing the results of a poll, comparing responses from Canterbury to those from the rest of New Zealand.

A page banner promoting earthquake-related articles.

Graphs showing the status of business insurance claims.

A map showing the location of damaged public artworks.

A page banner promoting an article titled, "Decisions, decisions...".

A map showing buildings to be demolished in City Mall.

The front page graphic for the Mainlander section of The Press. The main headline reads, "Decisions, decisions...".

A map showing the location of courts in Canterbury.

A graph showing the result of an online poll which asked, "Should the Dux de Lux be reopened urgently?".

A chart showing the number of settled EQC contents claims.

An incomplete infographic about access being given to the red zone for home and business owners.

A map showing the location and magnitude of aftershocks.

The front page graphic for the At Home section of The Press. The main headline reads, "Getting through".
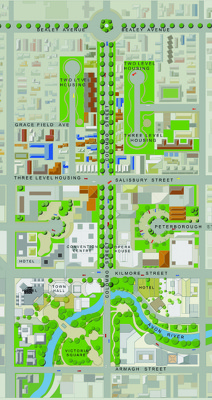
A map showing details of the Central City Plan.