
A graphic illustrating quotes about the '100 days' city plan.

A map showing the location of tsunami warning systems.

A map showing the epicentre of a large aftershock.

A map showing closed roads in the city centre.

An illustration of the Quake Lights in Cathedral Square.

A map showing the status of housing in Kaiapoi.

A chart showing the rescue package for AMI Insurance.

A map showing the locations and magnitudes of aftershocks.

A word cloud with terms relating to the Christchurch rebuild.

Page banner for the "Faultlines" special report.

A map showing the location of damaged public artworks.

A cartoon about City Care operating in the Red Zone.

A map showing the location of courts in Canterbury.

A map showing the location and magnitude of aftershocks.
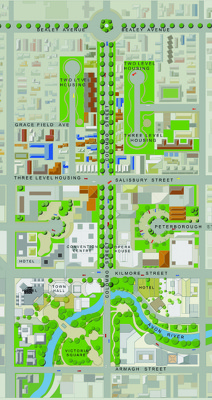
A map showing details of the Central City Plan.

An infographic showing inflation for the March 2011 quarter.

A banner reading, 'The Big Quake, Canterbury, September 4, 2010'.

A map showing the location and magnitude of aftershocks.

A map showing the swimming water quality at Christchurch beaches.

Page banner for the "Faultlines" special report.

An infographic illustrating an email from the Director of Boxpark.

A chart showing the hotels occupied by EQC staff.

A map showing the locations of businesses in Sydenham.

A map showing the status of businesses on High Street.

Page banner for the "Faultlines" special report.

Page banner for the "Faultlines" special report.

Graphs illustrating the results of a survey of Christchurch residents.

A map showing the location of Holy Trinity Church.

A page banner promoting an article titled, "The estuary".

A graph showing the University of Canterbury's projected operating deficit.