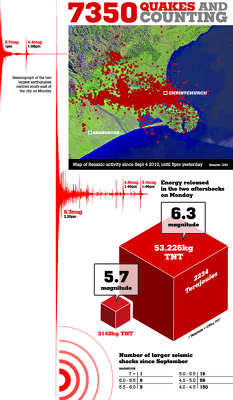
An infographic describing the 13 June 2011 earthquakes.

An advertisement for the "Fight for Christchurch" event.

A guide to the National Christchurch Memorial Service.

A page banner with images from the earthquake.
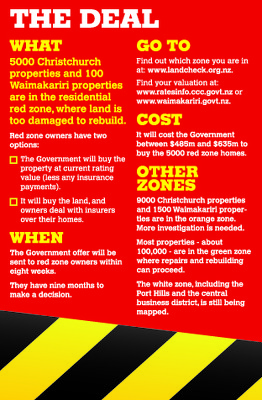
An infographic describing the residential red zone offer.

An incomplete infographic showing the proposed Transitional Cathedral.

An infographic comparing property values across the South Island.
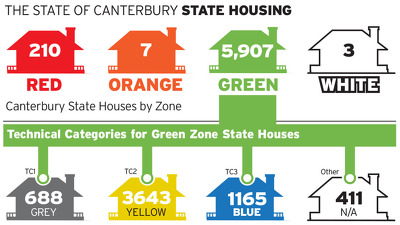
An infographic showing the status of state housing.
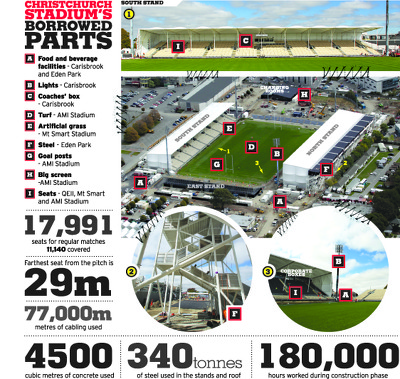
An infographic giving details of the temporary stadium.

A graphic comparing the salaries of Canterbury mayors.

A two-page feature titled, 'The Land Report'.

A map showing the locations of earthquake fatalities.

A map showing the locations of earthquake fatalities.

A map showing the status of hill suburbs.

A chart showing the status of EQC claims.

Graphs showing the status of business insurance claims.

A map showing the location of fault lines.

A map of the Canterbury A&P Show.

An uncompleted map showing the locations of aftershocks.

An infographic describing damage to the Arts Centre.

A banner with the headline, 'A nation remembers'.

A chart showing the status of EQC claims.

An infographic showing the proposed Addington City Stadium.

A page layout for the "Faultlines" special report.

A chart showing the status of EQC claims.

A map showing road closures in the central city.

A page banner promoting articles about the Christchurch rebuild.

A graph showing the Employer Outlook for Christchurch.

A graphic for a feature titled, "The hard yards".
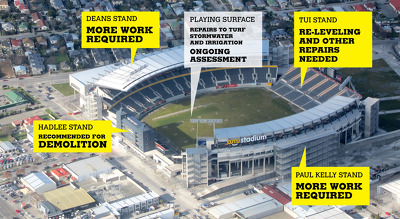
An infographic showing the status of AMI Stadium.