
An infographic comparing house sale prices in Christchurch.

A promotion for an upcoming issue of The Press, featuring an article titled, "Walking in quake-land".

A map showing a proposed memorial area along the Avon River.

An infographic giving details of Christchurch City Council spending.

A promotion for an interactive online tool for finding new subdivisions.

A map showing the location of the Bridgewater Apartments.

A page banner promoting earthquake-related articles.

A map showing the status of hill suburbs.

A map showing the voting pattern for the Christchurch Central electorate.

A map showing the location of the temporary bus exchange.

A map showing Green, Orange, Red, and White Zones in Kaiapoi.

A graph showing the number and magnitudes of earthquakes since 4 September 2010.
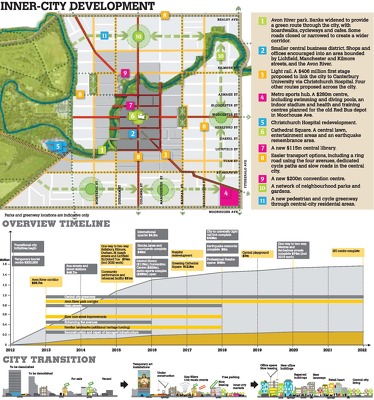
An infographic giving an overview of the draft Central City Plan.

An uncompleted chart showing numbers of performances by the Court Jesters.

A chart showing the status of EQC claims.

A graph showing changes in residential building work.

A timeline for the Recovery Strategy.

A page banner promoting an article titled, "Rapping in the rubble".

A graph showing population change in Christchurch by age group.

An infographic about the planned upgrades to Christchurch Hospital and Burwood Hospital.

A page banner promoting an article about business closures in Sumner.

A page banner promoting an article titled, "Planning a new home".

A map of the proposed Peterborough village.

An infographic showing areas of Kaiapoi likely to be abandoned.

Page banner for the "Faultlines" special report.

Graphs comparing residential property prices across Christchurch and New Zealand.

A graphic to accompany an article titled, "City Council business divide".

A map showing the airport noise contour relative to residential developments in Kaiapoi.

A map showing Green and White Zones on Banks Peninsula.

An uncompleted map showing the proposed locations of car parks in the central city.