
Graphs showing the results of an opinion poll on satisfaction with EQC.

A page banner for a feature on school closures.

Graphs showing the results of a survey on proposed school closures.

A page banner promoting an article titled, "CTV building".
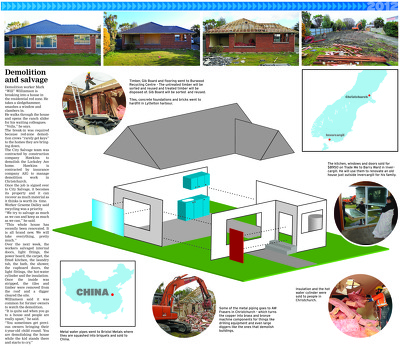
A page layout for a Zone Life feature on the history and demolition of one red-zoned house.

A page banner promoting articles about a repair report for Christ Church Cathedral, and the controlled demolition of Radio Network House.

A chart comparing rates of migration to Australia in Canterbury with other New Zealand regions.

An incomplete front page layout for the Sunday Star Times, featuring an article about a proposed shared cathedral.

A page banner promoting earthquake-related articles.

An infographic made up of graphs showing the proportion of relief funds remaining unspent.

A page banner promoting an article titled, "Rebuild overseer works part-time".

A timeline for the consultation on changes to Christchurch schools.

The right-hand section of a timeline of the CTV building.

A table giving the number of earthquakes recorded in Christchurch and North Canterbury since 4 September 2010.

A graph showing the results of an opinion poll which asked, "How do you feel in buildings?".

A table showing the expected number of teachers to be lost in Christchurch.

A guide to the statuses given for schools.

A chart showing relationships between public sector entities, private companies, Ngai Tahu, and Canterbury earthquake recovery tasks.

The front page graphic from the Mainlander section of The Press, featuring an item about Gerry Brownlee.

Graphs comparing residential property prices across Christchurch and New Zealand.

A page banner promoting an article titled, "Christchurch 'being run from Wellington'".

A graphic showing UK housing developments that could inform the Christchurch rebuild.

A map showing the location of heritage buildings.

An infographic showing business recovery in Christchurch.

A page banner promoting an article titled, "Smashing success".

A chart showing rental price increases across Christchurch since 2011.

An infographic comparing rises in rental prices in Christchurch with the rest of New Zealand.

A graphic giving information on the University of Canterbury's financial losses.

A page banner promoting an article about a family's memories of their red-zoned house.

A map showing the location of major projects proposed in the Christchurch Central Development Unit's blueprint.