
A map showing the location of fault lines.

A map showing the South Island electorates.

A graph comparing industrial vacancies in Christchurch.
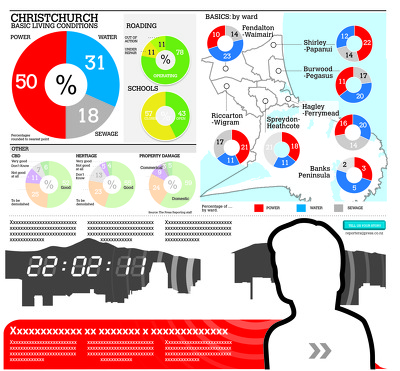
An incomplete infographic showing damage to services.

A page banner listing earthquake-related articles.

A page banner listing earthquake-related articles.

A page banner listing earthquake-related articles.

An infographic describing damage to AMI Stadium.

A time-line titled, 'The road to recovery'.

An infographic about hydraulic fracturing in Canterbury.

A page banner promoting earthquake-related articles.

A graphic showing proposed central city developments.

A map showing residential property developments in Canterbury.

A map showing changes to bus routes.

A page banner listing earthquake-related articles.

A page banner listing earthquake-related articles.

A graph showing increases in rental prices.

A page banner listing earthquake-related articles.
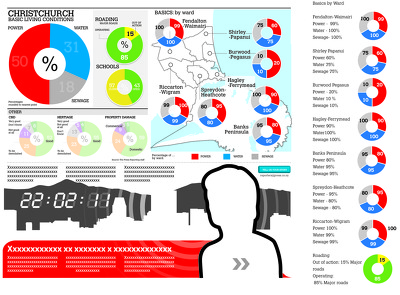
An incomplete infographic showing damage to services.

A map showing the changes to electorate enrolments.

Graphs comparing vacant industrial land across Christchurch.

A page banner listing earthquake-related articles.

A map showing the locations of aftershocks.

A page banner listing earthquake-related articles.

An infographic showing aspects of the recovery.

A graphic describing the status of heritage buildings.

A page banner advertising a 'Project Canterbury' feature.

A graphic showing economic opportunities for Christchurch.

The logo for the 'Band Together' concert.

A page banner listing earthquake-related articles.