
A map showing the route of the Red Zone bus tour.

A map showing the voting pattern for the Christchurch Central electorate.

A map showing the route of the Rugby World Cup parade.

A graphic showing the cost of infrastructure repairs across the city.

A map showing the route of the Red Zone bus tour.

A infographic giving the status of large buildings in the central city.

A chart showing the drop in public transport patronage following the earthquakes.

A graph comparing the Christchurch price index to the New Zealand index.

A map showing the drop zones of critical buildings in the CBD.

The front page graphic for a feature marking the anniversary of the 22 February 2011 earthquake. The feature is titled, "Beyond the call".

A full-page infographic listing the victims of the 22 February 2011 earthquake.

An infographic describing the collapse of the stairwell in the Forsyth Barr building.

An infographic describing the collapse of the stairwell in the Forsyth Barr building.

The logo for a feature about the Royal Commission into the Canterbury earthquakes.

An infographic explaining the structure and funcion of the Canterbury Earthquake Recovery Authority (CERA).

An infographic comparing spending increases across the South Island during the Rugby World Cup.

In eight frames a man searches for a house in Christchurch and a real estate agent tries to sell him one. In each case the estate agent tries to emphasise the positives but the buyer sees the negatives brought about by the earthquakes. In the end the buyer settles for a caravan. Context - The problems of buying and selling houses in post-earthquake Christchurch.
Quantity: 1 digital cartoon(s).

A graphic showing the collapse sequence of the PGC building.

A timeline for the opening of the Re:Start mall.
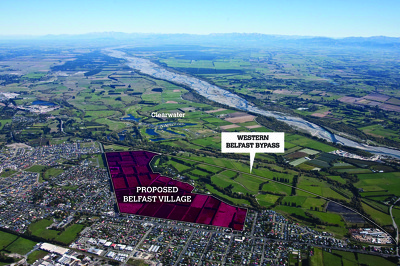
An infographic showing the location of the proposed Belfast village.

A map showing the location of the temporary bus exchange.

A map showing the new route for the Santa Parade.

A timeline for the demolition of the Hotel Grand Chancellor.

A graph showing the impact of the earthquakes on workplaces.

A map showing the extent of the Greendale fault trace.

A map showing the new route for the Santa Parade.

A map showing the access route to the Rendezvous Hotel.

Graphs showing the effect of the earthquakes on energy use.

A map showing the revised route for the Santa Parade.

A chimpanzee paints with a palette of colours. Context: After the earthquakes in Christchurch buildings and areas were designated green, blue, red or white depending on the degree of damage. Buildings in the 'red' zone were then examined to ascertain whether they should be demolished or restored and sometimes the land itself was deemed unsafe. There have been many controversial decisions made which is the point the cartoon makes.
Quantity: 1 digital cartoon(s).