
A graph comparing housing consents issued in Christchurch, Auckland and Wellington.

Two images of a house, taken before and after the earthquakes. In the after photograph the chimneys are gone, a column supporting the car port has partly collapsed, windows are broken, and the previously neat lawn and driveway are overgrown. The photographer comments, "This was a house that I was selling up to the September 2010 earthquake in Christchurch. It was on Avonside Drive, which was an area that has been badly hit in every earthquake that has hit the area. In the September quake parts of the house moved in different directions and one of the upstairs doors had to be smashed open to release one of the sons from his bedroom. This occurred in the dark with numerous aftershocks shaking the house. Liquefaction poured up through the floor and flowed down the drive. Everyone got out OK, but soon after the house was red stickered meaning it was dangerous to enter. The house was looted many times even though there was constant police patrols. When the most violent earthquake occurred on 22 February 2012 both the tall heavy chimneys came crashing through into the living areas. Subsequent earthquakes and aftershocks have caused one of the brick fence pillars to fall and the front garage pillar to break up and twist. The family's troubles did not end there. They moved into the home of one of their parents and this mansion of a home was so badly affected by the February earthquake that no one could enter to collect any of their or their parents' belongings. They now own a new home, which they are fond of except when the ground shakes yet again. There has been to date 10,712 earthquakes and aftershocks since 4 September 2010".

Illustrations of types of inner-city housing.

Graphs comparing residential property prices across Christchurch and New Zealand.

Graphs comparing residential property prices across Christchurch and New Zealand.
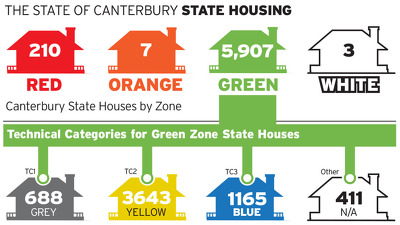
An infographic showing the status of state housing.
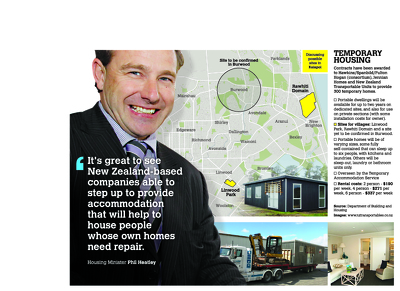
An infographic giving details of proposed temporary housing.

A page banner promoting an article about prefab housing.

A map showing the status of housing in Kaiapoi.

From a house truck labelled 'Dunrentin' the occupant claims that since the Feb 2012 earthquake this is the only accommodation that his family can afford.
Since that earthquake, the reultant damage to housing had caused housing rentals to soar, beyond the reach of many of theose displaced.
Quantity: 1 digital cartoon(s).

A graph showing changes in house prices in Canterbury and Westland.

A map comparing changes in property values in Christchurch and surrounding areas.

A graphic comparing house prices in the east and south-west of Christchurch.

A graphic promoting a feature on house prices on the press.co.nz website.

A graph comparing changes property values across Christchurch suburbs.

A graphic showing measures to be taken to increase housing in Christchurch.

A graphic showing UK housing developments that could inform the Christchurch rebuild.

Shows an enormous Earthquake Recovery Minister Gerry Brownlee portrayed as a house for rent being viewed by a couple. Context: Brownlee announced plans to alleviate Christchurch's housing shortage by increasing rental stocks (Stuff 24 April 2012)
Quantity: 1 digital cartoon(s).

A graph comparing rent increases in Christchurch and other regions.

An infographic showing changes in median rents from September 2011 to September 2012.

An infographic describing the Department of Building and Housing guidelines for foundations on TC3 land.

An infographic describing the Department of Building and Housing guidelines for foundations on TC3 land.

An infographic outlining the findings of the Department of Building and Housing's expert panel on building collapses.

A graph showing economic recovery in Canterbury.

Photograph captioned by Fairfax, "Minister of Housing Phil Heatley inspects a state house on Robson Avenue in Avonside".

Photograph captioned by Fairfax, "Minister of Housing Phil Heatley inspects a state house on Robson Avenue in Avonside".

A map showing the location of a proposed subdivision in Rolleston.

A map showing the location of the proposed Stonebrook subdivision.

Graphs showing statistics on residential red zone demolitions.

Text reads 'Did you put the cat out and lock and back door?'. Shows car parked in Christchurch City at night. Context: People have been sleeping in their cars due to housing shortage created by Canterbury earthquakes of 2010 and 2011 (Stuff 29 March 2012)
Quantity: 1 digital cartoon(s).